New research highlights areas of under-representation across British industry
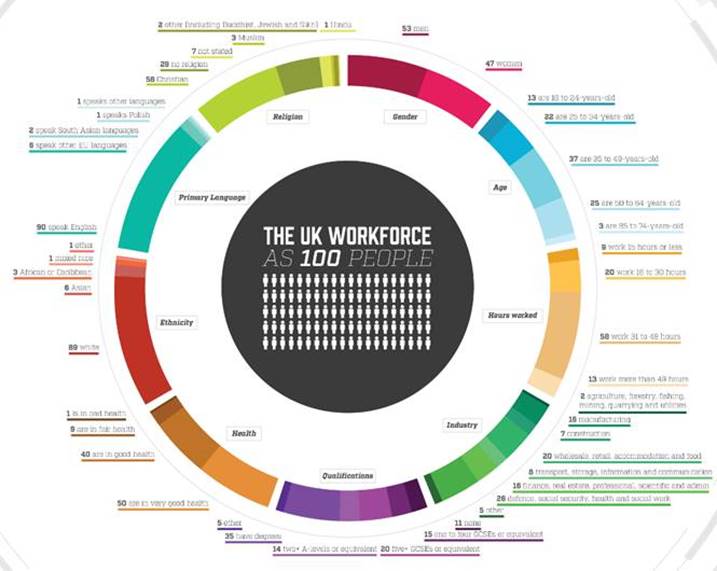
A new study by office furniture suppliers, Viking Direct, has visualised the UK workforce as 100 people. The firm has analysed data from the Office of National Statistics, to highlight under-representation in staff across the country and make the data more accessible. The results have illustrated areas of current under-representation.
When the UK workforce as 100 people is compared to the UK population in the same form, the following points are found:
· Women are under-represented in the UK workforce by four people
· People of Asian ethnicity are under-represented by two people
· Those of mixed race are under-represented by one person
· Muslims are under-represented by two people
· Hindus are under-represented by one person
· Christians are under-represented by one person
· People in bad or very bad health are under-represented by five people
According to the study People of African Caribbean ethnicity are neither under represented or over represented at 3% of the population with a make up 3% of the work force. However questions were not asked as to the representation of these groups at different levels of the workforce.
Another surprising fact is that Christians are under represented in the workforce. This figure would need further analysis and better explanation in a country that still identifies itself as a largely Christian country.
Each of the 100 people in the visualisation represents 269,669 British workers, further illustrating the under-representation revealed by the research. This means that women are currently under represented in the UK workforce by 1,186,676 people.
The full research visualises the UK workforce as 100 people, based on nine demographics
The nine demographics analysed were:
1. Gender
2. Age
3. Hours worked
4. Industry
5. Qualifications
6. Health
7. Ethnicity
8. Language
9. Religion
Key points from the research have been animated in a video here.
The representation was created through analysis of 2011 census data. Population statistics for each demographic were calculated as a percentage of the whole, which was in turn converted to the nearest whole number out of 100.
Claire Porciani, Senior Manager of HR at Viking Direct UK, says about the research:
“Visualising the UK’s workforce as 100 people has made it easier to identify areas where people are being under-represented. Hopefully
“The under-representation highlighted by the research indicates a need for managers to assess diversity in their organisation and try and address any imbalances. Examine whether your workplace is welcoming to everyone. Are their prayer spaces? Is it easy to navigate and use for those with mobility issues? If these elements are missing, it can be off-putting for those that need them.”
For more information view: https://blog.viking-direct.co.uk/uk-workforce-100-people